covidregionaldatagraphs
Sub-national COVID graphs for Lithuania
COVID-19 Data Charts for Lithuania
This page presents a set of static charts representing data on the COVID-19 pandemic in Lithuania. These charts show only past data.
This code uses the
covidregionaldata package
to download data for various countries at a subregional level. The
workflow is currently set to install the github version of the package.
This page has some additional graphs specific to Lithuania, in addition to those available in the other page of graphs showing COVID-19 data for Lithuania
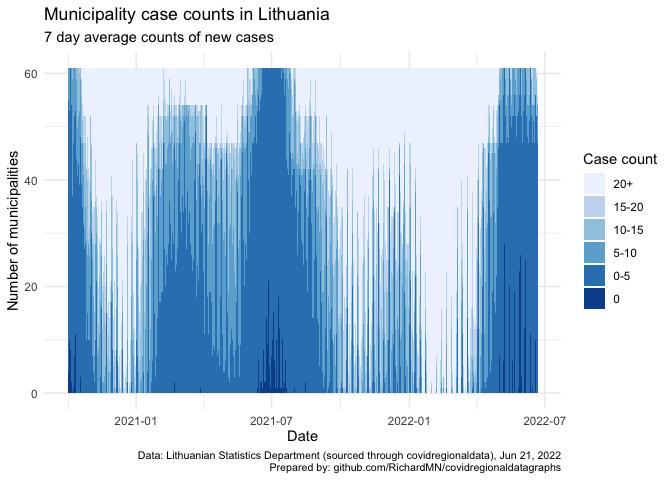
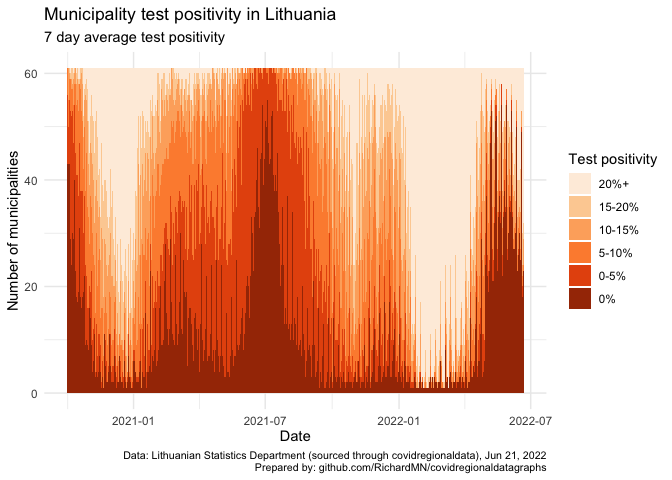
Overall comparisons of municipalities
Two charts imitating those prepared by the OSP in their analyses.
Incidence charts
Ridgeline charts showing the incidence in regions of the country. These emphasise that the first wave was barely a ripple compared with the second wave, and that the incidence in the larger cities (particularly Vilnius) has been quite separate from other municipalities.
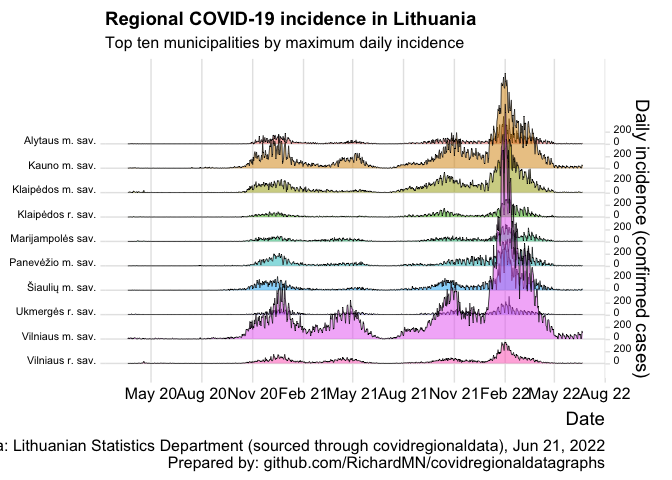
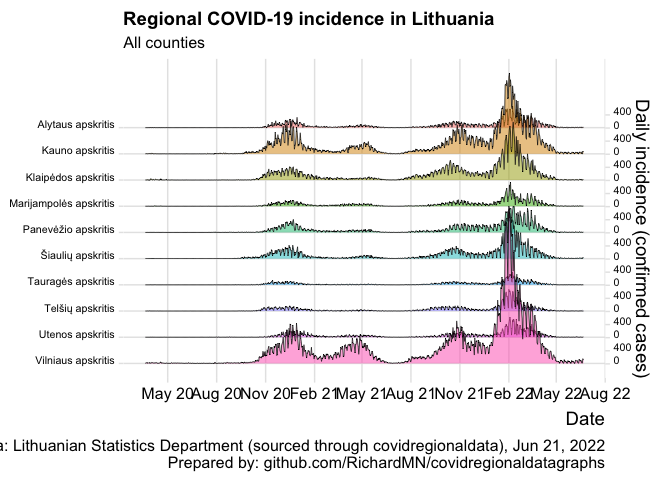
The Lithuanian word for “municipality” is savivaldybė. “m. sav.” is short for “city municipality” and “r. sav.” means “regional municipality”; Vilnius and Kaunas both have suburban municipalities which are distinguished in these charts only by the “m.” and “r.”
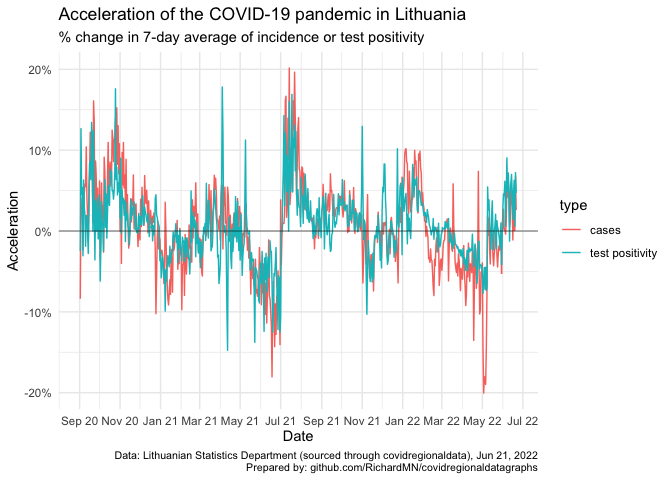
Acceleration of case incidence and test positivity nationwide
Acceleration is another measure used by OSP. It is intended to give a more responsive indicator of the development of the pandemic, particularly in comparison with 7- and 14-day averages. The time-averaged values are used to smooth out regular weekly variation in the data but are necessarily lagging indicators, both when incidence is rising and when it is declining.
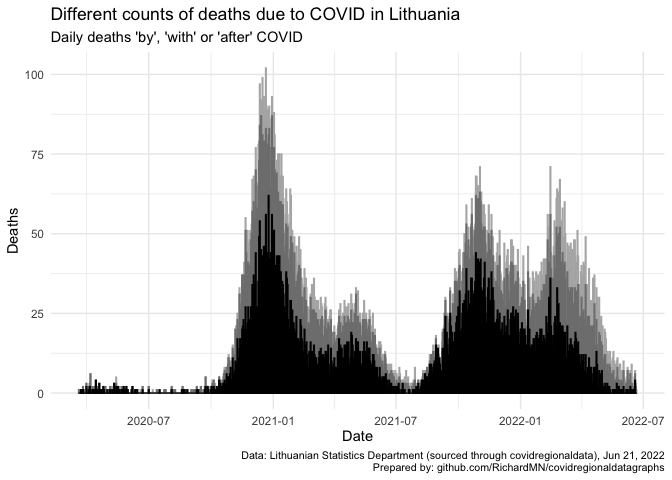
Attributions of deaths
The OSP provides counts for three different criteria attributing deaths to COVID, which roughly correspond to “of”, “with” and “after”. This chart provides a comparison of how the three number of deaths attributed to COVID according to each criterion compare.