The Omicron wave is different
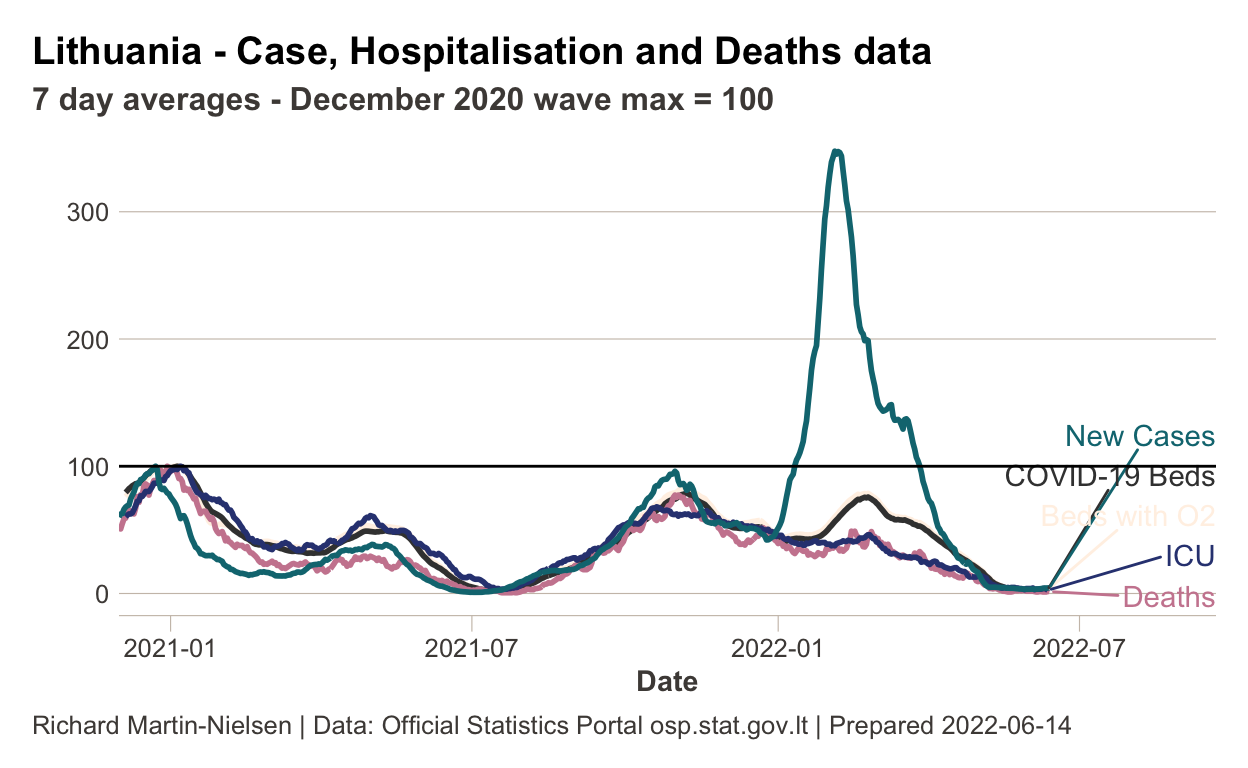
As has been seen in many other countries, the Omicron wave of COVID-19 has shown a weaker link between case incidence and hospitalisation data. This may be attributed to the variant itself, to prior exposure to other variants, or to increased vaccination rates.
Lithuania is not much different and using data from the Official Statistics Portal we can compare time-averaged values for case incidence, hospital admissions with COVID-19, admissions requiring oxygen, admissions requiring mechanical ventilation and deaths due directly to COVID.1
The Omicron wave compared to others
As seen elsewhere, hospitalisation and deaths are much less correlated with incidence in the latest wave than in previous waves. This graph (similar to graphs from the Financial Times by John Burn-Murdoch) adjusts all curves, setting 100 as the maximum of the December 2020 wave (Lithuania’s pre-Omicron maximum). This also shows the time delay seen between the curves in previous waves.
Show code
lt_hosp_cv19 <- lt_hosp_data %>%
  filter(str_detect(event, "^cv19.*admissions")
         |str_detect(event, "^cv19.*in_use")
         |str_detect(event, "^cv19.*delta")
         |str_detect(event, "^cv19.*occupied")) %>%
  mutate( event = gsub("cv19_","", event)) %>%
  mutate( event = gsub("_r7m.*","", event)) %>%
  mutate( event = str_to_title(gsub("_"," ", event))) %>%
    mutate(event = case_when(
    event == "Admissions Oxygen" ~ "Admissions with Oxygen",
    event == "Admissions Mv"     ~ "Admissions on Ventilator",
    event == "Deaths Cov1"       ~ "Deaths",
    #event == "Hospital Beds Occupied" ~ "Admissions with Oxygen",

    #event == "Admissions Mv"     ~ "Admissions on Ventilator",
    TRUE ~ event
  ))
events_to_plot <- c(
               "Hospital Beds Occupied",
               "Oxygen Beds Occupied",
              # "Mv Beds Occupied",
               "Icu Beds Occupied"
              # "Icu Mv Beds Occupied",
              # "Icu Ecmo In Use",
              #"Admissions",
              #"with Oxygen",
              #"on Ventilator"
              )

lt_case_deaths <- lt_aggregate %>%
  group_by(date) %>%
  summarise(across(where(is.numeric), ~ sum(.x, na.rm=TRUE)), .groups = "drop") %>%
  mutate(date = as_date(date)) %>%
  pivot_longer(
    cols = !c("date"),
    values_to = "count",
    names_to = "event") %>%
    mutate( event = str_to_title(gsub("_"," ", event))) %>%
  group_by(event) %>%
  mutate(count = zoo::rollmean(count,k=7, fill=NA, align="right") ) %>%
  ungroup()

lt_hosp_cv19_max <- lt_hosp_cv19 %>%
  bind_rows(lt_case_deaths) %>%
  filter(date > ymd("2020-11-01") & date < ymd("2021-7-01") ) %>%
  group_by(event) %>%
  summarise(max = max(count)) %>%
  # fudge things slightly: admissions must be > admissions O2 so we'll set it to 250
  mutate(max = if_else(event == "Admissions", 250, max))

lt_hosp_nrml <- left_join(bind_rows(lt_hosp_cv19, lt_case_deaths), lt_hosp_cv19_max, by=c("event")) %>%
  # mutate( count = case_when(
  #   event=="Admissions" && count == 0  ~ NA_real_,
  #   TRUE ~ count ) ) %>%
  # filter(!(event == "Admissions" & count == 0)) %>%
  mutate(normalised= count / max * 100) %>%
    filter(event %in% c(
      #"Icu Ecmo In Use",
                      #  "Admissions",
                        # "with Oxygen",
                        # "on Ventilator",
                        "Hospital Beds Occupied",
                        "Oxygen Beds Occupied",
                        # "Mv Beds Occupied",
                        "Icu Beds Occupied",
                      "New Cases",
                      "Deaths Cov1"
                      #"Icu Ecmo In Use"
                      )) %>%
  mutate(event = case_when(
    event == "Deaths Cov1"            ~ "Deaths",
    event == "Hospital Beds Occupied" ~ "COVID-19 Beds",
    event == "Oxygen Beds Occupied"   ~ "Beds with O2",
    event == "Icu Beds Occupied"      ~ "ICU",
    TRUE ~ event
  )) %>%
  #filter(!(event=="Admissions" && normalised == 0)) %>%
  arrange(date)

lt_hosp_nrml %>%
  ggplot(aes(x=date,y=normalised, colour=event)) +
  geom_line(size=1) +
    geom_text_repel(aes(x=date,y=normalised,label=event,colour=event),
                  nudge_x=100,
                  direction="y",hjust="right",
                  data = arrange(lt_hosp_nrml,event,date)%>%
                    group_by(event)%>%
                    summarise(across(everything(), last)) ) +
                  #data=group_by(lt_hosp_nrml%>%filter(date == ymd("2022-01-13")), event)%>%tail(6)) +
  geom_hline(yintercept = 100) +
  ft_theme() +
  scale_color_ft("origami primary") +
  theme(legend.position = "none") +
    labs(title="Lithuania - Case, Hospitalisation and Deaths data",
       subtitle="7 day averages - December 2020 wave max = 100",
       y="",
       x="Date",
       caption=paste0("", caption_text)) +
  scale_x_date(limits = c(ymd("2020-12-01",NA)),expand = expansion(add = c(0,100))) +
  scale_y_continuous(limits = c(0,NA))
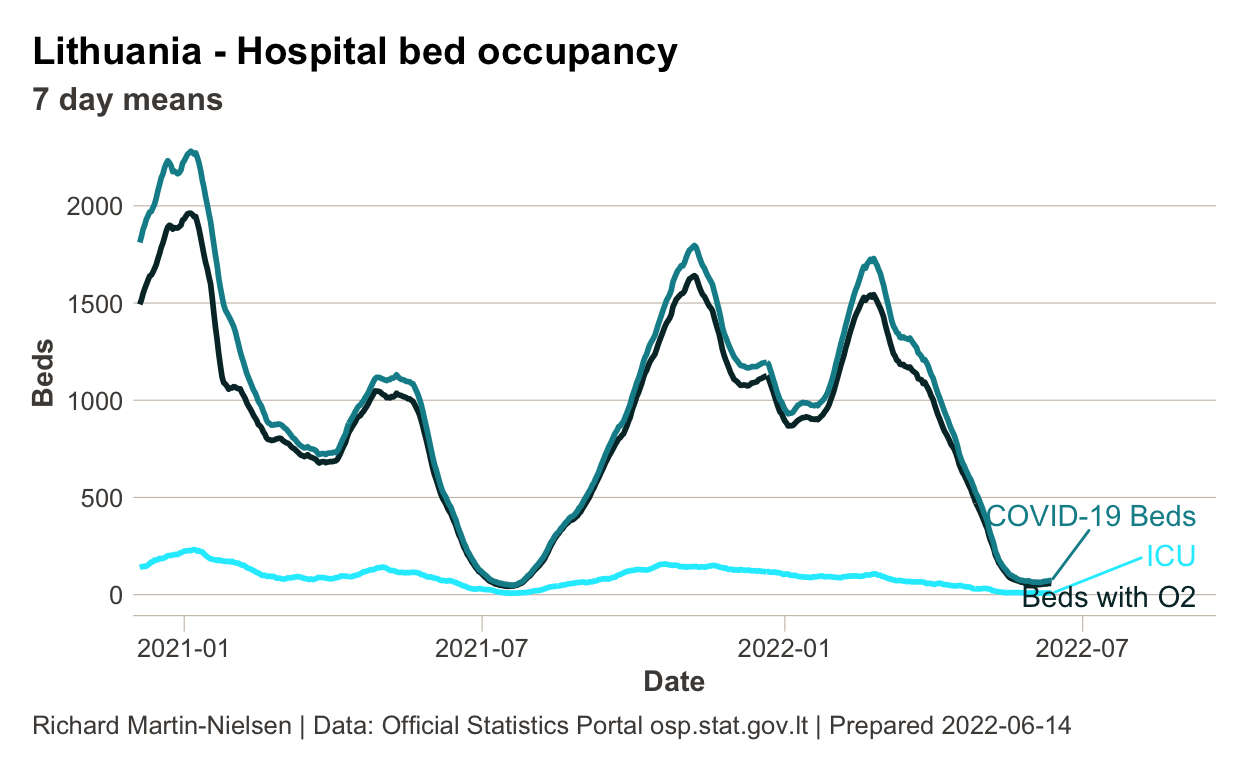
Hospital occupancy since late 2020
This plot shows COVID-19 related hospital bed occupancy since late 2020.
Show code
lt_hosp_occupancy_labelled <- lt_hosp_cv19 %>%
  filter( event %in% events_to_plot) %>%
    mutate(event = case_when(
    event == "Deaths Cov1"            ~ "Deaths",
    event == "Hospital Beds Occupied" ~ "COVID-19 Beds",
    event == "Oxygen Beds Occupied"   ~ "Beds with O2",
    event == "Icu Beds Occupied"      ~ "ICU",
    TRUE ~ event
  ))

lt_hosp_occupancy_labelled %>%
  ggplot(aes(x=date,y=count, colour=event)) +
  geom_line(size=1) +
  geom_text_repel(aes(x=date,y=count,label=event,colour=event),
                  nudge_x=75,
                  direction="y",hjust="left",
                  data = arrange(lt_hosp_occupancy_labelled,event,date)%>%
                    group_by(event)%>%
                    summarise(across(everything(), last))) +
  ft_theme() +
  scale_color_ft("teal") +
    #scale_colour_viridis_d() +
  theme(legend.position = "none") +
    labs(title="Lithuania - Hospital bed occupancy",
       subtitle="7 day means",
       y="Beds",
       x="Date",
       caption=caption_text
         ) +
   scale_x_date(limits = c(ymd("2020-12-01",NA)),expand = expansion(add = c(0,100)))
Data source
These charts are drawn using data published by the Official Statistics Portal (OSP) on their COVID-19 open data site.
The R markdown source is available as a github repo.
Dataset description (google translation)
google translation of original Lithuanian2
7-day averages for available and occupied inpatient beds, oxygen-supplied beds, beds in intensive care and resuscitation wards, artificial lung ventilation equipment and its use, ECMO systems and their occupancy, patient flow, and amounts of Remdesivir.
Data is updated in the morning at 10:00.
Description of information provided:
| field | description |
|---|---|
date |
reporting day (end date of the reporting period 16: 00-16: 00) |
hospital_name |
the name of the hospital |
healthcare_region |
region (five territorial health insurance funds) |
hospital_beds_total_r7mean |
total number of inpatient hospital beds (without RITS!) |
hospital_beds_occupied_r7mean |
number of inpatient hospital beds (without RITS!) |
oxygen_beds_total_r7mean |
all beds with oxygen supply (part of hospital_beds_total) |
oxygen_beds_occupied_r7mean |
occupied beds with oxygen supply |
mv_beds_total_r7mean |
all beds with artificial lung ventilation (DPV) (part of hospital_beds_total) |
mv_beds_occupied_r7mean |
busy beds with DPV options |
icu_beds_total_r7mean |
resuscitation and intensive care (RITS) beds (not part of hospital_beds_total!) |
icu_beds_occupied_r7mean |
busy RITS beds (not part of hospital_beds_occupied!) |
icu_ecmo_systems_total_r7mean |
total number of RITS beds with ECMO systems |
icu_ecmo_systems_in_use_r7mean |
number of occupied RITS beds with ECMO systems |
cv19_hospital_beds_assigned_r7mean |
Number of beds for COVID patients |
cv19_hospital_beds_occupied_r7mean |
number of occupied COVID beds |
cv19_oxygen_beds_assigned_r7mean |
COVID oxygen beds for patients |
cv19_oxygen_beds_occupied_r7mean |
occupied oxygen beds for COVID patients |
cv19_mv_beds_assigned_r7mean |
COVID Patient Beds with Artificial Lung Ventilation (DPV) |
cv19_mv_beds_occupied_r7mean |
occupied COVID patient beds with DPV capabilities |
cv19_icu_beds_assigned_r7mean |
COVID Patient Resuscitation and Intensive Care (RITS) Beds |
cv19_icu_beds_occupied_r7mean |
busy RITS beds for COVID patients |
cv19_icu_mv_beds_assigned_r7mean |
COVID Patient RITS Beds with Artificial Lung Ventilation (DPV) |
cv19_icu_mv_beds_occupied_r7mean |
occupied RITS beds for COVID patients with DPV capability |
cv19_icu_highflow_systems_total_r7mean |
COITS for RV beds with high-flow system |
cv19_icu_highflow_systems_in_use_r7mean |
busy COITS RITS beds with high-flow system |
cv19_icu_ecmo_assigned_r7mean |
RITS beds for COVID patients with EKMO system |
cv19_icu_ecmo_in_use_r7mean |
busy RITS beds for COVID patients with EKMO system |
cv19_admissions_r7mean |
new COVID patients (daily) |
cv19_admissions_oxygen_r7mean |
new COVID patients receiving oxygen |
cv19_admissions_mv_r7mean |
new COVID patients with artificial lung ventilation |
cv19_discharges_r7mean |
COVID patient checkouts / departures |
remdesivir_vials_used_r7mean |
used Remdesivir vials |
remdesivir_patients_total_r7mean |
Number of patients receiving Remdesivir |
remdesivir_patients_new_r7mean |
Number of new patients receiving Remdesivir |
Lithuania publishes mortality data according to three different levels of attribution to COVID. The most restrictive is used here.↩︎
https://open-data-ls-osp-sdg.hub.arcgis.com/datasets/f8f5c84b20e24ff99be4dd472d377640_0/about↩︎